The study of algorithmic trading is of high importance given its predominance and forecasted growth. In 2019 the majority of the equity traded in US was executed by algorithms, equivalent to 35.1% of $31 trillion and the global estimated compounded annual growth rate (CAGR) over the period 2020-2027 is 8.7%.
The topic presents many issues and angles. Institutional investors employ big human and capital resources to take advantage of algorithmic trading, while retail investors have limited but growing opportunities. Secondly, the number of treading strategies is big, tending to infinite assuming parameters change, which makes the selection of strategies challenging. Thirdly, investors are by nature idiosyncratic and consequently do not exist one strategy valid for all.
The existing academic literature takes a strong financial mathematics stand; paying attention to market microstructure, cost measurement, or cost estimation just to cite some topics. There is a more pragmatical approach, captured by textbooks, with emphasis to build your own algorithmic trading system. However, very little attention is taken to algorithmic trading with existing trading planforms like QuantConnect or AmiBroker and algorithm libraries like Quantpedia as foundation to articulate the research.
The research purpose of this article is to study algorithmic trading strategies, using the repository of algorithms from Quantpedia and QuantConnect as foundation of the strategies and QuantConnect as trading platform. Particularly, the number of strategies is three: buy and hold, volatility risk premium (VRP) and sentiment momentum. The study takes two angles in the evaluation, per se and consolidated.
The research question is investor concentric rather than mathematical focus. From the three algorithmic trading strategies, which one might be the best for an investor with an investment horizon of five years? The answer is not straight forwards, because investors have different profiles of reward-risk, age, social and familiar circumstances.
Research methods
The time horizon of this piece of work is longitudinal for a period of seven years, from 2014-01-01 to 2020-12-31. Though, it is also cross-sectional with particular interest at the end of the study in December of 2021.
The data input collection is from secondary sources. The financial time series are from QuantConnect, that holds a crowd-curated data library for commodities, securities and currencies in multiple timeslots that allow a fast and reliable backtesting algorithm execution. For the sentiment analysis, the data comes from Tiingo, a database of millions of articles with more than 15 years of history. The sampling is non-probabilistic and very purposive because the research uses only one trading vehicle, the exchange-traded fund (ETF) SPDR S&P 500 trust (SPY) and its derivatives, in the form of call and put options.
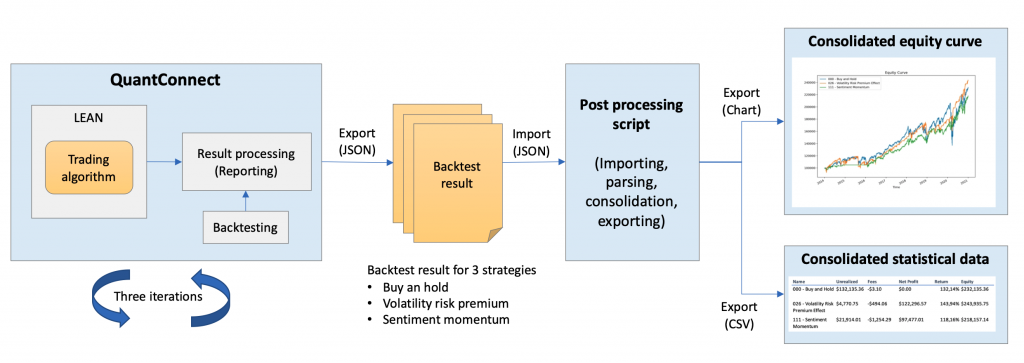
The study requires to execute each algorithm with QuantConnect and consolidate the results to build a comprehensive conclusion that helps to answer the research question. The next figure depicts the complete research process.

Firstly, each strategy is executed in QuantConnect using the lean algorithmic adding engine (LEAN) in backtesting mode; as result, it provides a rich graphical and numeric information within the QuantConnect environment. Secondly, the results of the backtesting are exported in a JSON file. The process is repeated three times, one per each strategy; eventually, three JSON files are obtained. Next, a post-processing script is run, to import the three files, parsing the data, consolidate it and export the information in two sets, the chart of consolidated equity curve and the CSV file with consolidated statistical data.
Three algorithmic trading strategies
Buy and hold
The strategy is rooted in the efficient market hypothesis (EMH) in its strong form, that states that the prices is the stock market reflect very rapidly all financial and economic information. This constitutes a fundamental theory in financial asset pricing with studies in favour and against.
If the EMH stands true, an investor cannot exploit inefficiencies in the market to archive consistently returns higher than the market, unless higher risk is taken. Consequently, the buy and hold strategy is a good proxy of the EMH, because the investor just buys a portion of the market for a period of time and sells it at the end to receive the benefit.
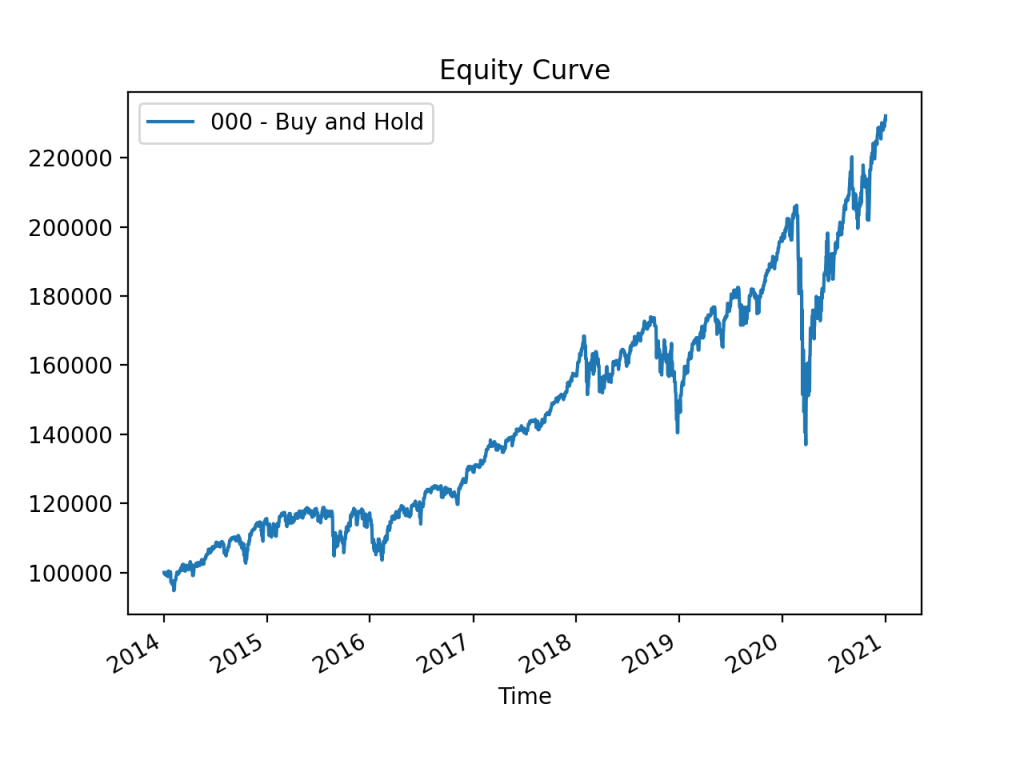
The implementation of the buy and hold strategy is extremely simple, it buys $100000 in SPY stock at the beginning of the backtesting period and sells it at the end, therefore it consists in two trades only.

The previous figure presents a summary of the backtesting result of the strategy. With an investment of $100000 the total net profit is $132135 that constitutes a return of investment (ROI) of 132% and compounding annual growth return (CAGR) of 12,8%, an attractive return for an equity investment. Because the strategy just follows the market, particularly the SPY that constitutes the 500 biggest companies per capitalization in US, it presents a very distinctive traits, such as the Chinese stock crash and oil plunges in 2016, the trade war US-China and Federal Reserve (Fed) fast interest rates raising in 2018, and the beginning of COVID-19 crisis in 2020.
The strategy is extremely efficient, only 2 trades are necessary that implies a low trading cost of $3. This has a big fiscal advantage compared with strategies with high number of trades, because the taxes are paid by annualized realized profit. Nevertheless, this study does not account the fiscal impact, but certainly, it should be considered for a rounded analysis.
In terms of risk, the maximum drawdown (MDD) is 33,6% relatively high and produced by the COVID-19 crisis at the beginning of 2020. The annual standard deviation (SD) is 0,16 and the Sharpe ratio is 0,75, both parameters are basically the systemic risk and reward-risk indicator of the equity market in US.
This strategy just follows the market, consequently, the performance and risk parameters are the benchmarking, in other words, the reference to compare with other strategies with similar undelaying financial vehicle.
Backtest result in QuantConnect
Volatility risk premium
The historical volatility of equities tends to be higher than the imply volatility, the difference is called volatility risk premium (VRP). The academic research suggests that VRP is caused by the dislike of investors to negative returns, and consequently, they are willing to pay a premium to hedge their portfolios.
The VPR can be harvested with option strategies, variance swaps or CBOE volatility index (VIX) futures. This strategy tries to exploit the VRP effect with options derivatives of SPY.
The algorithm is derived from Quantpedia. It sells every month at-the-money straddles options of SPY with an expiration date of one month to harvest 5% of the option premium, the left-over of capital is invested in SPY. The portfolio is partially protected against market crash purchasing out-of-the-money puts 15% lower than SPY security.
The implementation is prone to calibration, p.e. the grade of leverage of the strategy, the value of out-of-the-money puts, or usage of plain at-the-money puts rather than straddles.

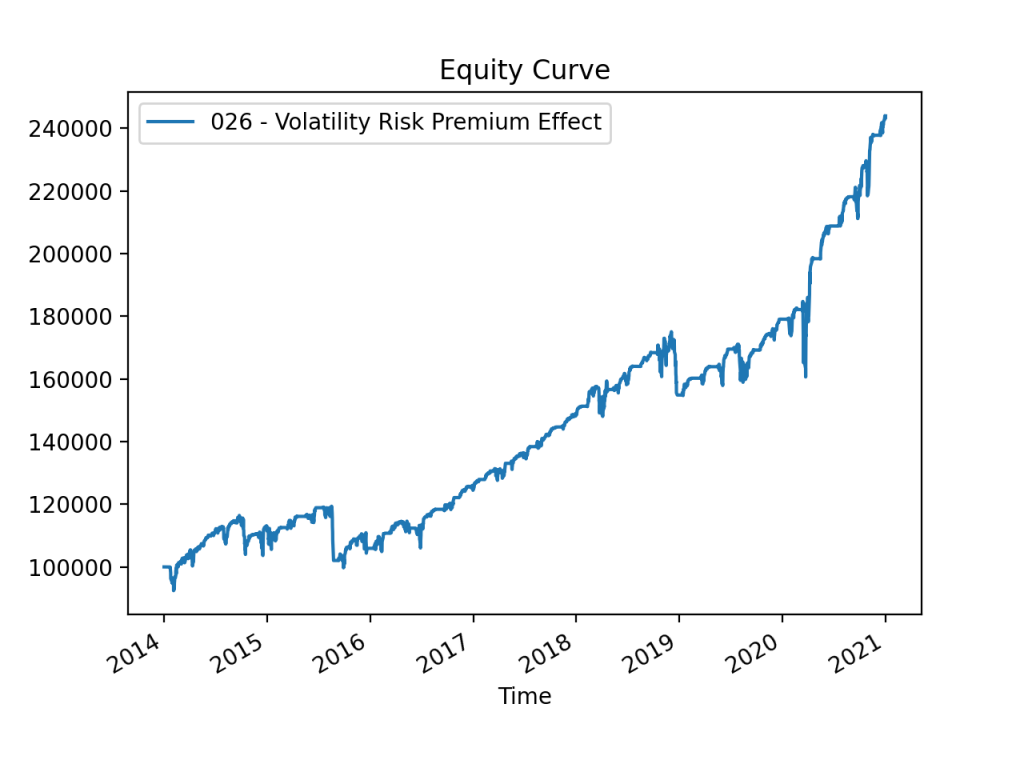
The previous figure embodies the result of the simulation. With an investment of $100000 the total net profit is $143936 that constitutes a ROI of 144% and CAGR of 13,6%; although it is apparently high return, is a relatively modest number considering that the strategy is based on derivatives that are inherently riskier than normal equity. The strategy is not very effective navigating the drops of Chinese stock market and crude oil plunges in 2016, however it does a better job with the drop due to the US-China trade war and Fed rising interest rates in 2018 and extremely well during the COVID-19 crisis in 2020.
The total number of trades is 444 that implies $494 in trading fees. The fees are relatively low considering the number of trades, this is because the algorithm uses SPY derivatives that are very liquid in the market. Because the algorithm trades regularly, it is fiscally less efficient than a buy and hold strategy.
The risk indicators of the strategy are relatively favorable. The MDD is 16,4% a recognition of an efficient way to overcome the COVID-19 crash, the annual SD is 0,13 which is relatively low, a reflect that the hedging mechanism with out-of-the-money puts is effective, and the Sharpe ratio is 1,13, which is relatively high, driven by a high return and low annual SD.
Backtest result in QuantConnect
Sentimen momentum
The sentiment momentum strategy falls in the group of momentum strategies, a key category together with mean-reverting strategies. Momentum strategies are founded in the believe that prices present trends, and therefore, the assets should be purchased long in positive regimes, and short in negative regimes. The trends can be caused by rational or “irrational” causes; the underpinning theory of this strategy is the heard behaviour as described by behavioural finance, that drives “irrational” trends by investors herds.
The strategy enters in conflict with EMH and the random walk hypothesis (RWH). The RWH states that the stock prices follow a random walk or random behaviour, theory supported by empirical evidences in favour and against. Under certain circumstances the prices might follow a trend, and this is what the sentiment momentum strategy tries to exploit.
The algorithm is an adaption from QuantConnect library and consists in the creation of sentiment indicator that triggers the decision to buy or sell SPY stock. In this case, short positions are not allowed and the threshold for the buy/sell decision is five, an arbitrary number.
The indicator is created by the sum of the scores of a rolling window from the last 100 articles from Tiingo. The rolling window of 100 articles helps to provide more widespread sentiment, it acts like a filter that eliminates noise. The scores are defined evenly by 33 words grouped in positive words like good, great or growth with a value of 0,5 points and negative words like failed, missed or poor with a value of -0,5 points. This algorithm has many opportunities for tunning, such as the value of the buy/sell threshold, enable of SPY short selling, the duration of the rolling windows, or the number and meaning of the scores.

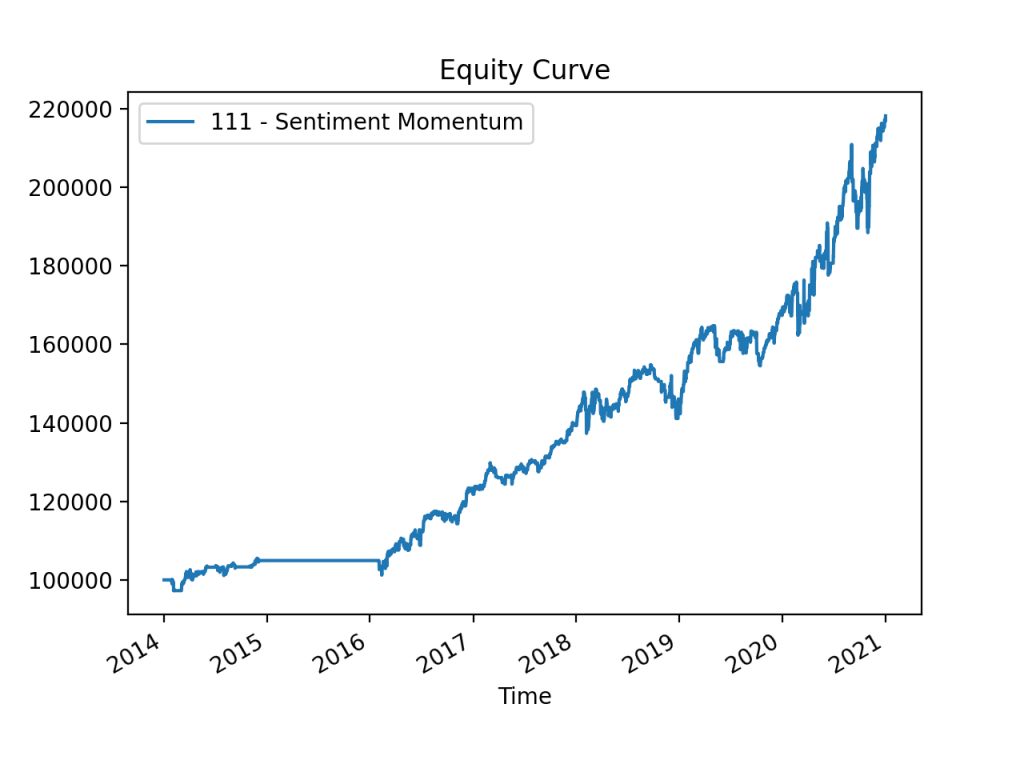
The previous figure captures the result of the backtesting. With an investment of $100000 the total net profit is $118157 that implies a ROI of 118% and CAGR of 11,8%; the return is fairly high for a strategy based on equities. It is remarkable that the strategy did not trade during the Chinese stock market crash and crude oil plunges in 2015, obviously driven by a negative sentiment in the market, and it is particularly interesting how well the strategy overcame the trade was US-China and Fed raising interest in 2018, and the COVID-19 crisis in 2020 as well.
The total number of trades is 478 that implies $1254 of trading fees. The value is slightly high especially considering that the algorithm did not trade in 2015; it could be optimized to limit the number of trades, but nevertheless, the algorithm needs to be judge holistically. Like VRP, this algorithm trades regularly, so in a taxable account, it requires declaring benefits yearly. The risk indicators are attractive. The MDD is 10,7%, a low value that reflects an effective method to avoid drops in the equity curve, the annual SD is 0,09 a low value more present in bonds than equities, and the Sharpe ratio is 0,99, a relatively low value driven by a modest ROI.
Backtest result in QuantConnect
Consolidated results and discussion
If you are interested to know what is the best strategy for investors with an investment horizon of five years, I invite you to download the complete research coursework.
The consolidated results and discussion chapter articulates a holistic evaluation of the strategies considering all statistical variables and graphical information. It argues about the best strategy for investors, considering the overall performance, the investor’s fiscal situation, and the reward-risk appetite.
The download includes:
- Complete coursework research in PDF format.
- Post-processing script in Phyton to consolidate the data with settings in Visual Studio Code.
- Trading algorithms from the three strategies in Phyton for QuantConnect.
- The backtesting results from QuantConnect from the three strategies.


