- Date: 2020
- Developed by: Raúl Bartolomé
- Customers: Academic / personal research in quantitative finance
- Creators: Individual project
- Raúl’s contribution: Design and implementation of the full solution
- Market: Finance / Data Science / Research
- Product category: Website and quantitative finance tools
In 2020, Raúl Bartolomé developed an application for financial data acquisition and visualization, as part of his research in quantitative finance and algorithmic trading. The project was intended to demonstrate how interactive tools could make financial datasets more accessible for research, testing, and educational purposes.
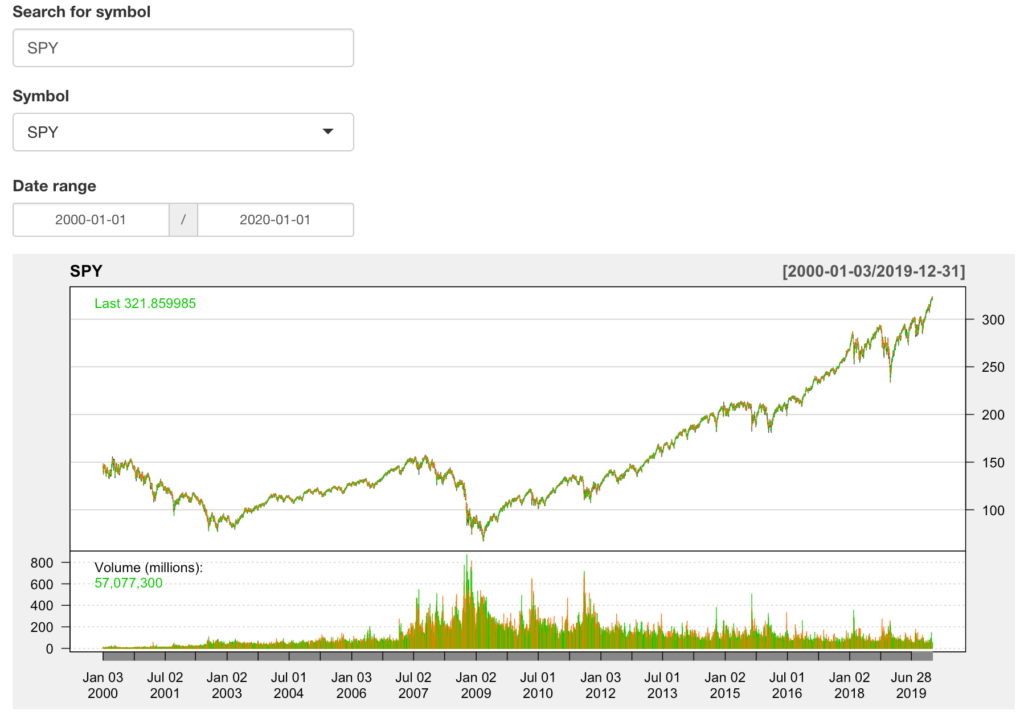
The application allowed a user to select a financial symbol from a list, automatically generating updated charts of historical data. This made it possible to quickly explore stock behavior, visualize price patterns, and study time series dynamics — a fundamental capability in modern finance research. While the symbol search functionality was not fully operational, the prototype already showed the potential for embedding interactive market dashboards directly into a research or personal finance website.
Technical Approach
The core of the application was built with the R programming language, using the Shiny framework. Shiny provides an environment for creating web applications where user inputs (list boxes, buttons, and filters) can drive dynamic outputs (interactive charts, tables, and statistical results). This flexibility made it ideal for quantitative finance, where researchers often need to manipulate time series data in real time.
To make the application available in a web environment, Raúl integrated the Shiny app into WordPress. The deployment followed two steps:
- Development and hosting in RStudio — The application was first created as a Shiny app and hosted on RStudio’s servers, where it could run in a managed environment.
- Embedding into WordPress via iFrame — An iFrame bridge was used to allow website visitors to interact with the app seamlessly, without leaving the page. This approach enabled a professional presentation of a finance research tool on a standard website.
Challenges and Lessons Learned
While the prototype worked successfully, it also illustrated some of the practical challenges of deploying live research tools. Running Shiny apps requires maintaining compatibility with a constantly evolving set of R libraries. Over time, as these libraries were not updated, the hosted app eventually stopped functioning. For this reason, the site now presents a screenshot of the app rather than a live version.
However, the full source code remains available to run locally in RStudio, ensuring that the project continues to serve as a valuable teaching example. It demonstrates how researchers can take raw financial data, process it through R, and present it interactively on the web.
Research Relevance
This project connects directly to Raúl’s broader academic and professional interests in quantitative finance, asset pricing, and algorithmic trading. Interactive data visualization is a critical tool for exploring hypotheses, evaluating covariates, and developing machine learning models. By bridging financial research and web integration, this project anticipated the growing demand for intuitive, browser-based financial analytics.
The Acquisition of Quantitative Finance Data project stands as an early step in Raúl’s journey of combining engineering, finance, and technology — the same interdisciplinary approach that underpins his later work in algorithmic trading and predictive modeling.
Screenshot of the application in a web browser:


